E4A IoT Manager
Cloud-based scalable and secured IoT management platform tailored for E4A IoT devices.

Industrial IoT
Management &
Monitoring
E4A-IoT-Manager is a cloud-based IoT management and monitoring platform designed to provide seamless deployment and interaction between IoT administrators, managers, and E4A Devices and Gateways.
Built with a scalable architecture, the platform enables real-time telemetry data ingestion, storage, visualization, and management, making it an ideal solution for industrial IoT applications.
Real-Time Telemetry
Monitor live data from connected devices
Scalable Cloud Architecture
Ensures flexibility and growth
Device Tracking & Management
Keep track of IoT devices with ease
Data Security
Robust security features to protect sensitive information.
Advanced Analytics
Gain valuable insights to improve operational efficiency.
Platform Features:

Continuous and accurate data flow

Seamless integration across devices

Real-time insights and centralized control

Reliable performance in any industrial environment
Seamless Realtime Monitoring
The E4A-IoT-Manager is designed exclusively for the E4A family of gateways and sensing devices, offering a seamless, automated approach to IoT device management. Its core capability is processing self-descriptive telemetry packets, which eliminate manual configuration and enable quick deployment.
By leveraging these telemetry packets, the E4A-IoT-Manager provides a structured and automated method for device tracking, data monitoring, and advanced analytics. This means that each incoming data transmission is pre-associated with key device information

Faster and more reliable data processing
Instant device identification and tracking
Seamless data integration into dashboards and reports
Real-time insights for better decision-making
key functionality
Core Capabilities
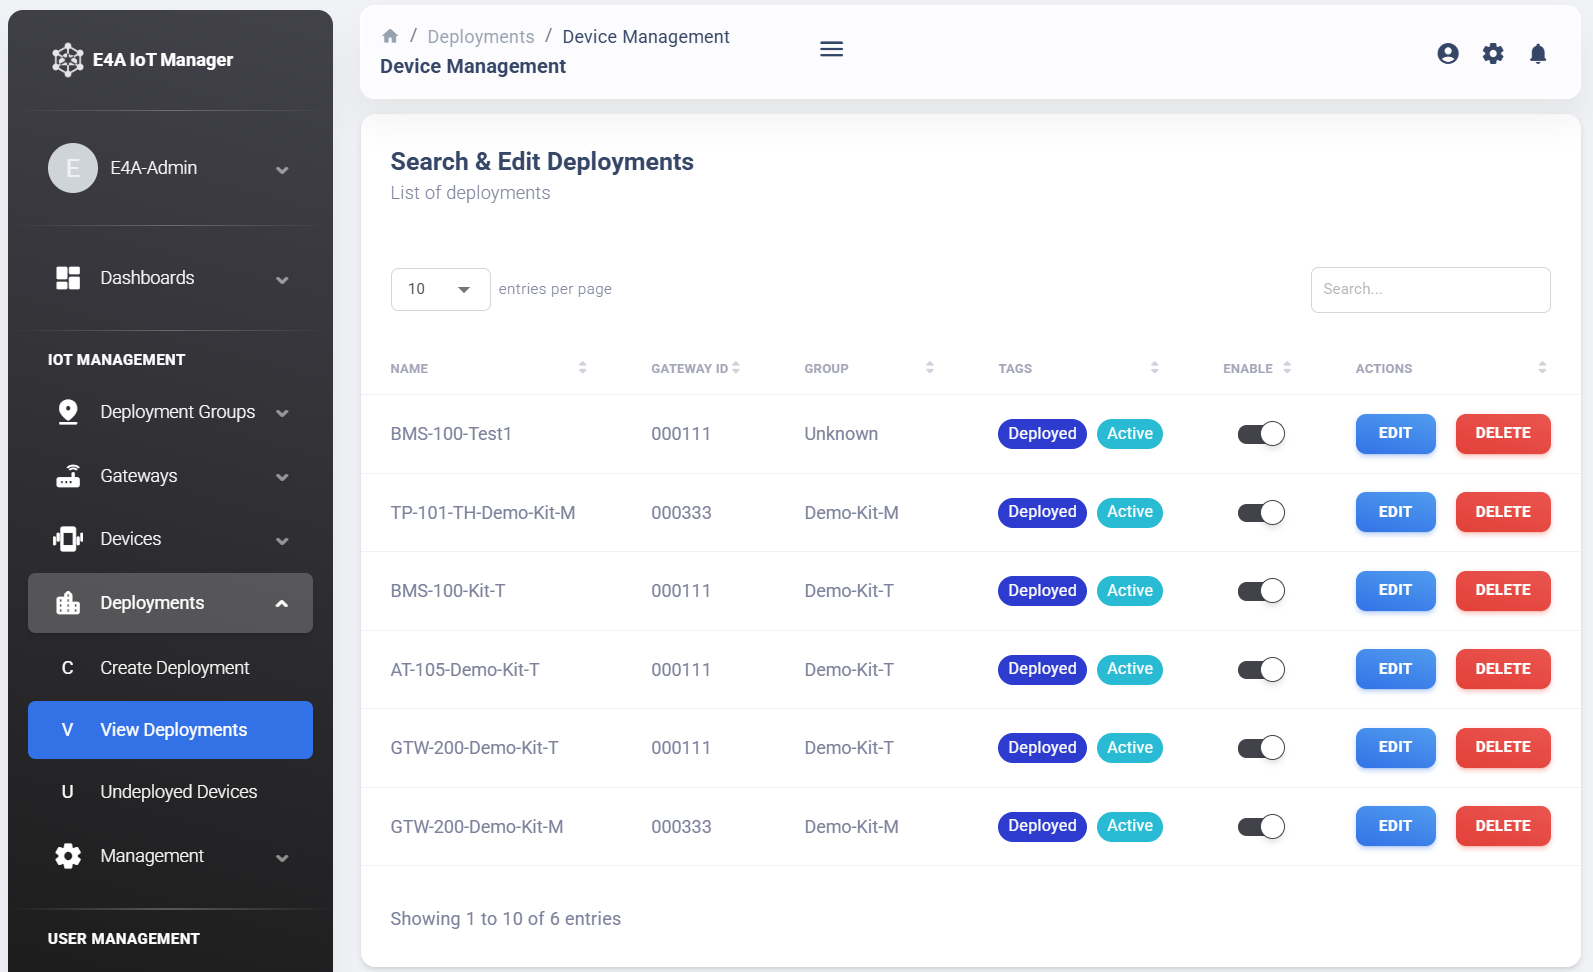
Deployment Management
Streamlined device and gateway setup.
Device Monitoring
Real-time status tracking.
Data Visualization
Clear, interactive data charts.
System Diagnostics
Quick issue detection and resolution.
System Metrics
Provides real-time performance insights on system health and usage.
User Management
Secure access and role control.
Real-Time Sensor Data for IoT Optimization
Voltage
Tracks power levels for efficient energy management.
Temperature
Measures ambient conditions for industrial and environmental monitoring.
Humidity
Provides moisture level readings for climate-sensitive applications.
Fault Status
Detects system anomalies and malfunctions.
Light Intensity
Detects and analyzes ambient lighting conditions.
Firmware Version
Displays the software version for maintenance tracking.
Acceleration
Captures motion and vibration data.
RSSI
Monitors network connectivity.
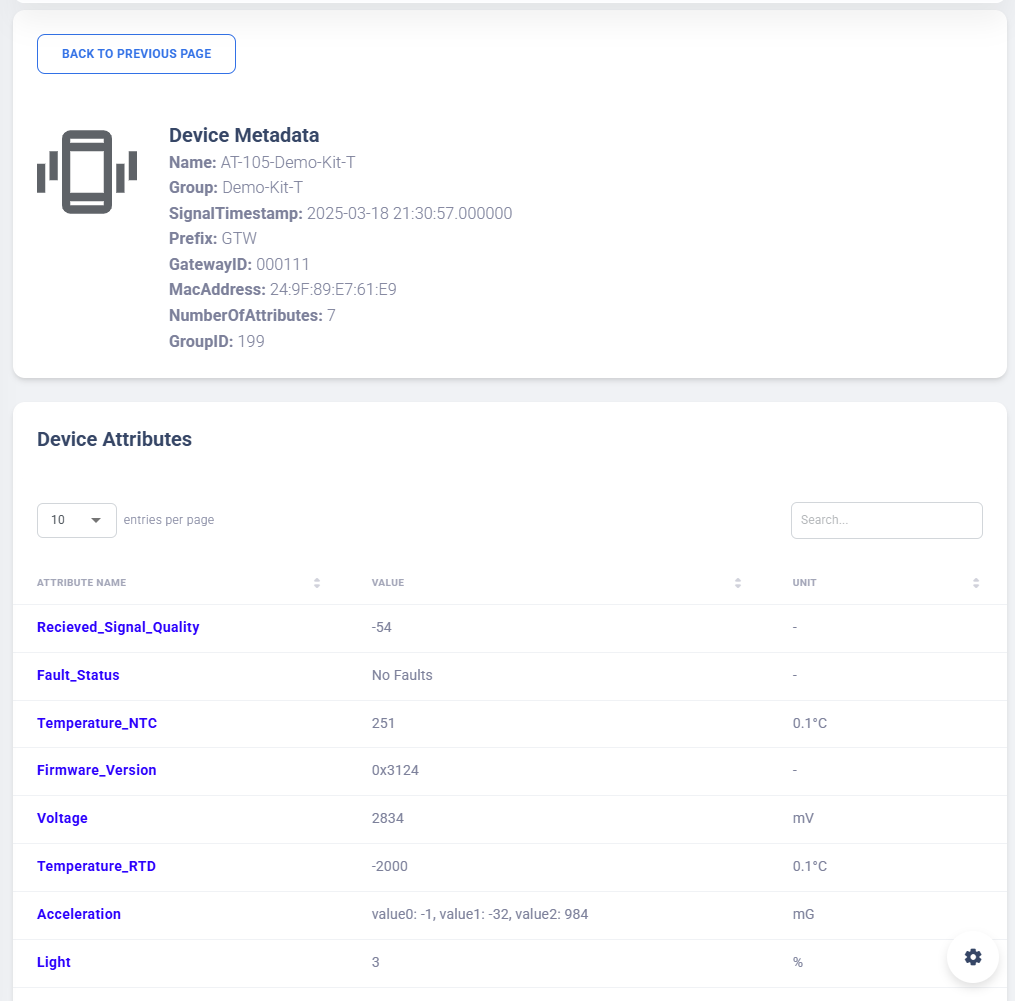
Device Metadata
Deployment Group ID
Identifies the assigned group of a device.
MAC Address
Uniquely identifies the reporting device.
Signal Timestamp
Records the exact time of data transmission.
Attribute Information
Provides context about transmitted data points.
Gateway ID
Tracks the specific gateway handling the device’s data.
Our Solution facilitates
Realtime Data Ingestion
Continuously collects data from connected devices without delay.
Realtime Data Processing
Instantly analyzes and filters data for actionable results.
Timeseries Data Storage
Stores chronological data for accurate analysis.
User friendly web portal
Manage devices, data, and users with ease through a sleek UI.
Rapid & Easy Deployment
Plug-and-play setup reduces deployment time and complexity.
Robust Cloud Infrastructure
Built to grow your business and handle increasing workloads.
Application-Focused Smart Visualizations
Our Application-Focused Smart Visualizations offer powerful and intuitive tools that enable users to monitor and manage critical resources and environmental conditions through real-time, data-driven insights. With advanced visualization techniques, these applications transform complex data into easily interpretable visuals, empowering users to make faster, more informed decisions with greater confidence and accuracy.
Transform raw sensor data into actionable insights with our industry-specific visualizations designed to enhance operational decision-making. Whether you’re optimizing environmental safety, monitoring water resource usage, or our dashboards present data in a way that’s meaningful and easy to interpret. By turning raw data into clear, visual representations, we make it simple to identify trends and take immediate action.
HSS Visualizations And Analytics
The HSS-100 WBGT Insight application monitors workplace heat stress, visualizing WBGT, temperature, humidity, and globe temperature for better safety management.

CLS Water Level Application
The CLS-4-420-TH + Ultra Sound Transducer (4-20mA) Based Water Level Monitoring System tracks water tank levels in real-time, providing alerts and enhancing resource management across facilities.
")
Our Partners
Sub Heading
Sub Heading
Sub Heading
Sub Heading
Sub Heading
Sub Heading
Sub Heading
Get In Touch
Headquarters
Electronics4All
250 Herzberg Road
Ottawa, ON K2K 2A1
Lab Testing Facility
Hours
Monday – Friday: 8:30AM – 5PM EST
Saturday – Sunday: Closed